Operation
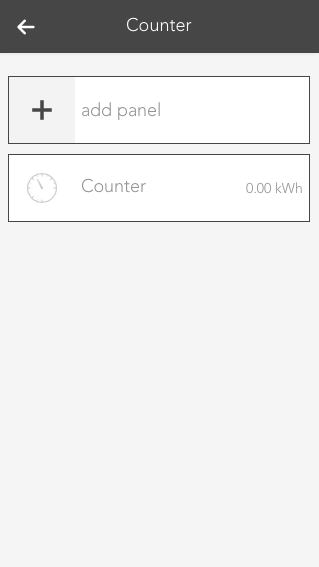
Once a Counter has been created, you can add additional visual panels. Those grant you an overview about the evaluated values.
To add such a panel, use the button "add panel".

In the popup which will appear, you can choose between several graphs/charts. To do so, you have to select the corresponding Counter under 'choose counter' and then one of the desired charts.
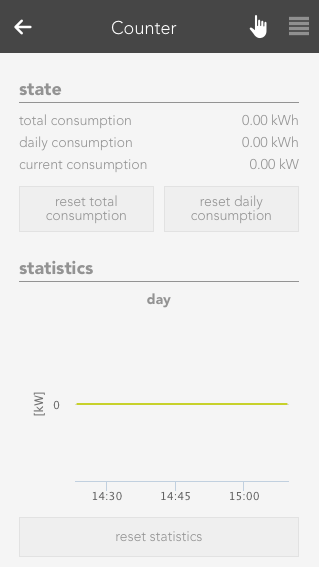
The OperatorPanel gives you an overview about the measured values. The following sections exist:
Status
Gives you information about the total, daily and current consumption. In addition, you can also reset the counter.
Statistic
The graphs/charts which you can activate in the ParamterPanel will be shown here. The statistics which are shown here can also be reset with the corresponding button.